Hematological blood analyzers are the workhorses of clinical laboratories. These high-performance instruments provide reliable counts of red blood cells, platelets and 5-component leukocyte formulas that identify lymphocytes, monocytes, neutrophils, eosinophils and basophils. The number of nuclear red blood cells and immature granulocytes are the 6th and 7th indicators. Although electrical impedance is still fundamental for determining the total number and size of cells, flow cytometry methods have proven to be useful in differentiating white blood cells and in blood tests with a hematological analyzer of pathological cells.
Analyzer evolution
The first automatic devices for quantitative blood testing, which appeared in 1950, operated on the basis of the principle of electrical impedance of Coulter, in which cells, passing through a small hole, broke the electric circuit. These were “prehistoric” analyzers that only counted and calculated the average volume of red blood cells, the average hemoglobin and its average density. Anyone who has ever counted cells knows that this is a very uniform process, and two laboratory assistants will never give the same result. Thus, the device has eliminated this variability.
In the 1970s, automated analyzers entered the market, capable of determining 7 blood counts and 3 components of the leukocyte formula (lymphocytes, monocytes and granulocytes). For the first time, manual counting of a leukogram was automated. In 1980, one tool could already calculate 10 parameters. The 1990s led to further improvements in leukocyte differentials using flow-based methods based on the properties of electrical impedance or light scattering.
Hematology analyzer manufacturers often seek to separate their devices from competitors' products, focusing on a specific package of technologies used to differentiate white blood cells or count platelets. However, laboratory diagnostics experts argue that most models are difficult to distinguish, since they all use similar methods. They just add extra features to make them look different. For example, one automatic hematology analyzer can determine leukocyte differentials by placing a fluorescent dye in the cell nucleus and measuring the brightness of the glow. Another can change the permeability and record the absorption rate of the dye. The third is able to measure the activity of the enzyme in a cell placed in a particular substrate. There is also a method of volumetric conductivity and scattering, which analyzes the blood in its "close to natural" state.
New technologies are developing towards flow methods, when cells are alternately examined by an optical system that can measure many parameters that have never been measured before. The problem is that each manufacturer wants to create their own method in order to preserve their identity. Therefore, they often succeed in one area and lag behind in another.
Current state
According to experts, all hematological analyzers on the market are generally reliable. The differences between them are insignificant and relate to additional features that some may like, but some may not. However, the decision to purchase an instrument usually depends on its price. If earlier, cost was not a problem, today hematology becomes a very competitive market, and sometimes pricing (and not the best available technology) affects the acquisition of the analyzer.
The latest high-performance models can work either as a stand-alone tool or as part of an automatic system with several instruments. The fully automated laboratory includes hematological, chemical and immunochemical analyzers with automated inputs, outputs and refrigeration units.
Laboratory instruments depend on the test blood. For its various types, special modules are required. The hematological analyzer in veterinary medicine is configured to work with the shaped elements of various animal species. For example, Idexx's ProCyte Dx can examine blood samples from dogs, cats, horses, bulls, ferrets, rabbits, gerbils, pigs, guinea pigs, and dwarf pigs.
Application of flow principles
The analyzers are comparable in certain areas, namely in determining the level of leukocytes and red blood cells, hemoglobin and platelets. These are ordinary, typical indicators, largely the same. But are hematological analyzers completely identical? Of course not. Some models are based on impedance principles, some use laser light scattering, and others use fluorescence flow cytometry. In the latter case, fluorescent dyes are used that stain the unique characteristics of cells so that they can be separated. Thus, it becomes possible to add additional parameters to leukocyte and erythrocyte formulas, including counting the number of nuclear red blood cells and immature granulocytes. A new indicator is the level of hemoglobin in reticulocytes, which is used to monitor erythropoiesis and immature platelet fraction.
Advances in technology begin to slow as entire hematological platforms emerge. Nevertheless, numerous improvements are still taking place. Almost standard now is a general blood count with the calculation of nucleated red blood cells. In addition, platelet count accuracy has increased.
Another standard function of high-level analyzers is to determine the number of cells in biological fluids. Counting white blood cells and red blood cells is a time-consuming procedure. Usually it is done manually on a hemocytometer, it takes a lot of time and requires qualified personnel.
The next important step in hematology is the determination of the leukocyte formula. If earlier analyzers could only mark blast cells, immature granulocytes and atypical lymphocytes, now there is a need for their counting. Many analysts mention them in the form of a research indicator. But most large companies are working on it.
Modern analyzers provide good quantitative, but not qualitative information. They are good for particle counting and can relate them to a specific category: red blood cells, platelets, white blood cells. However, they are less reliable in quality assessments. For example, the analyzer may determine that it is a granulocyte, but it will not be as accurate in determining the stage of its maturation. The next generation of laboratory devices should better evaluate this indicator.
Today, all manufacturers have perfected the technology associated with the Coulter impedance principle, and have adjusted their software to such an extent that they can extract as much data as possible. In the future, new technologies will be introduced using the functionality of the cell, as well as the synthesis of its surface protein, which indicates its function and stage of development.
Border with cytometry.
Some analyzers use flow cytometry techniques, in particular CD4 and CD8 antigen markers. Sysmex hematology analyzers come closest to this technology. Ultimately, there should be no difference between them, but for this it is necessary that someone sees this advantage.
A sign of possible integration is that they considered standard tests, which switched to flow cytometry, returning to hematology. For example, it will not be surprising if analyzers can perform fetal erythrocyte counting, replacing the manual Kleinhauer – Betke test technique. The test can be done by flow cytometry, but its return to the hematology laboratory will provide him with wider recognition. Probably, in the end, this terrible analysis in terms of accuracy will be more in line with what should be expected from diagnostics in the 21st century.
The boundary between hematology analyzers and flow cytometers is likely to shift in the foreseeable future as technologies or methodologies develop. An example is reticulocyte counting. At first it was made manually, then on a flow cytometer, after which it became a hematology instrument when the technique was automated.
Integration prospects
According to experts, some simple cytometric tests can be adapted for a hematological analyzer. An obvious example is the identification of regular subsets of T cells, direct chronic or acute leukemia, where all cells are homogeneous with a very clear phenotypic profile. In blood analyzers, scattering characteristics can be determined fairly accurately. Cases of mixed or truly small populations with unusual or more aberrant phenotypic profiles can be more complex.
However, some doubt that hematological blood analyzers will become flow cytometers. A standard test is much cheaper and should remain simple. If as a result of its conduct a deviation from the norm is determined, then it is necessary to undergo other tests, but the clinic or doctor’s office should not do this. If complex tests are performed separately, they will not add to the cost of conventional tests. Experts doubt that examining complex acute leukemia or the large panels used in flow cytometry will quickly return to the hematology laboratory.
Flow cytometry is expensive, but there are ways to reduce costs by combining reagents in different ways. Another factor that inhibits the integration of the test into the hematology analyzer is the loss of income. People do not want to lose this business, because their profits have already declined.
The reliability and reproducibility of flow analysis results is also important. Impedance-based methods are workhorses in large laboratories. They must be reliable and fast. And you need to make sure that they are economically viable. Their strength lies in the accuracy and reproducibility of the results. And as new applications in the field of cell cytometry appear, they still need to be proved and implemented. In-line technology requires good quality control and standardization of tools and reagents. Errors are possible without this. In addition, you must have trained personnel who know what he is doing and what he is working with.
According to experts, new indicators will appear that will change laboratory hematology. Those instruments that can measure fluorescence are in a much better situation because they have a higher degree of sensitivity and selectivity.
Software, rules and automation
While visionaries look to the future, manufacturers today are already forced to fight competitors. In addition to highlighting the differences in technology, companies highlight their products with software that manages data and automatically checks for normal cells based on a set of rules established in the laboratory, which greatly speeds up the verification and gives staff more time to focus on abnormal cases. .
At the analyzer level, it is difficult to distinguish the benefits of different products. To some extent, the availability of software, which plays a key role in obtaining analysis results, allows the product to stand out on the market. First of all, diagnostic companies enter the software market to protect their business, but then they understand that information management systems are necessary for their survival.
With each generation of analyzer software is greatly improved. New computing power provides much better selectivity when manually calculating the white blood cell count. The possibility of reducing the scope of work with a microscope is very important. If there is an accurate instrument, then it is enough to examine pathological cells on a hematological analyzer, which increases the efficiency of specialists. And modern appliances can achieve this. This is exactly what the laboratory needs: ease of use, efficiency, and reduced research under a microscope.
It is of concern that some doctors in clinical and laboratory diagnostics are concentrating their efforts on improving technologies, rather than on optimizing them for making correct medical decisions. You can buy the most bizarre laboratory instrument in the world, but if the results are constantly being checked, then this eliminates the capabilities of the technologist. Anomalies are not errors, and laboratories that automatically confirm only the result of the hematological analyzer “No pathological cells have been detected” are illogical.
Each laboratory should define criteria for which tests should be reviewed and which should be handled. Thus, the total number of human labor is reduced. There is time to work with abnormal leukograms.
The software allows laboratories to establish rules for auto-validation and detection of suspicious samples based on the location of the sample or study group. For example, if the laboratory processes a large number of samples of patients with cancer, the system can be configured to automatically study blood on a hematological analyzer of pathological cells.
It is important not only to automatically confirm normal results, but also to reduce the number of false positive results. Manual analysis is the most technically challenging. This is the most time consuming process. It is necessary to reduce the time that the laboratory assistant spends with a microscope, limiting himself only to abnormal cases.
Equipment manufacturers offer high-performance automation systems for large laboratories to help manage staff shortages. In this case, the laboratory assistant places the samples in an automatic line. The system then sends the tubes to the analyzer and then for additional tests or to a “temperature controlled” warehouse, from where the samples can be quickly taken for additional testing. Automated smear application and staining modules also reduce staff time. For example, the Mindray CAL 8000 hematology analyzer uses the SC-120 smear processing module, which is able to work with 40 μl samples when loading 180 glass slides. All glasses are heated before and after staining. This optimizes quality and reduces the risk of personnel exposure.
The degree of automation in hematology laboratories will increase, and the number of personnel will decrease. There is a need for complex systems in which you can place samples, switch to another job and return only to review truly anomalous samples.
Most automation systems are customized to the needs of each laboratory, and in some cases standardized configurations are available. Some laboratories use their own software with their own information system and abnormal sampling algorithms. But automation should be avoided for the sake of automation. Large investments in a robotic project of a modern expensive high-tech automatic laboratory are in vain due to an elementary error - repeated blood analysis of each sample with an abnormal result.
Automated counting
Most automatic hematology analyzers measure or calculate the following parameters: hemoglobin content, hematocrit, number and average volume of red blood cells, average hemoglobin, average cell concentration of hemoglobin, number and average platelet volume and leukocyte formula.
, .
, . . . , . , . . . .
« -6800», , . , , , 3D-. -6800 ( , ), ( ), .
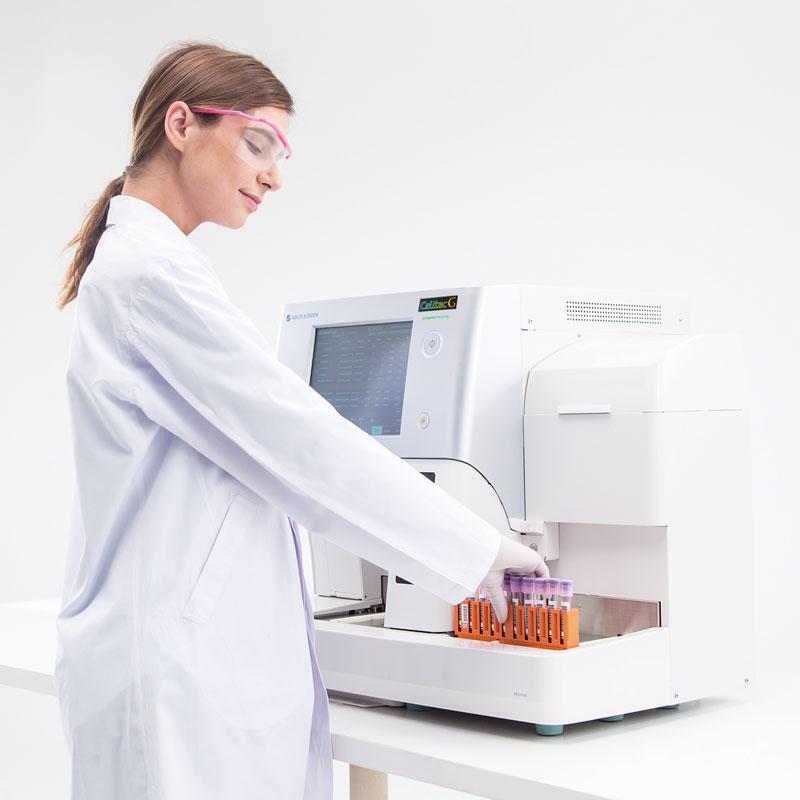
In the Nihon Kohden MEK-9100K hematology analyzer, the blood cells are perfectly aligned using a flow with hydrodynamic focusing before passing through the hole for high-precision impedance counting. In addition, this method completely eliminates the risk of re-counting cells, which greatly improves the accuracy of studies.
Laser optical technology Celltac G DynaScatter allows you to get the white blood cell in an almost natural state. The MEK-9100K hematology analyzer uses a 3-angle scattering detector. From one angle, you can determine the number of leukocytes, from another, you can get information about the structure of the cell and the complexity of nucleochromatin particles, and from the side, data on internal granularity and globularity. Three-dimensional graphic information is calculated using the exclusive Nihon Kohden algorithm.
Flow cytometry
It is carried out for blood samples, any biological fluid, dispersed bone marrow aspirate, destroyed tissue. Flow cytometry is a method that allows you to characterize cells by size, shape, its biochemical or antigenic composition.
The principle of this study is as follows. Cells move in turn through the cuvette, where they are exposed to a beam of intense light. The shaped elements of the blood scatter light in all directions. Direct scattering resulting from diffraction correlates with the volume of the cell. Side scattering (at right angles) is the result of refraction and approximately characterizes its internal granularity. Forward and lateral scattering data can identify, for example, populations of neutrophils and lymphocytes that differ in size and granularity.
Fluorescence is also used to detect various populations in flow cytometry. Monoclonal antibodies used to identify cytoplasmic and cellular surface antigens are most often labeled with fluorescent compounds. For example, fluorescein or R-phycoerythrin have different emission spectra, allowing the identification of shaped elements by the color of the glow. The cell suspension is incubated with two monoclonal antibodies, each of which is labeled with a different fluorochrome. Since blood cells with bound antibodies pass through a cuvette, 488-nm laser radiation excites fluorescent compounds, causing them to glow at specific wavelengths. A system of lenses and filters detects light and converts it into an electrical signal that can be analyzed by a computer. Different blood elements are characterized by different lateral and direct scattering and the intensity of the emitted light at certain wavelengths. Data compiled from thousands of events is collected, analyzed and summarized in a histogram. Flow cytometry is used in the diagnosis of leukemia and lymphomas. The use of various antibody markers allows accurate cell identification.
Sysmex hematology analyzer uses sodium lauryl sulfate to study hemoglobin. This is a non-cyanide method with a very short reaction time. Hemoglobin is detected in a separate channel, which minimizes interference from high white blood cell concentrations.
Reagents
When choosing a tool for blood testing, one should take into account how many reagents are required for the hematological analyzer, as well as their costs and safety requirements. Can I get them from any supplier or only from the manufacturer? For example, Erba ELite 3 measures 20 parameters with just three environmentally friendly and cyanide-free reagents. The Beckman Coulter DxH 800 and DxH 600 models use only 5 reagents for all cases, including counting nucleated red blood cells and reticulocytes. ABX Pentra 60 is a hematology analyzer that uses 4 reagents and 1 diluent.
Also important is the frequency of reagent replacement. For example, Siemens ADVIA 120 has a stock of chemicals for analytical research and flushing, which is enough to carry out 1850 tests.
Automated analyzer optimization
According to experts, too much attention is paid to improving laboratory tools and not enough to optimize the use of automated and manual technologies. Part of the problem is that hematological laboratory staff are trained in anatomical pathology, not laboratory medicine.
Many experts perform the functions of verification, rather than interpretation. The laboratory should have 2 functions: be responsible for the results of the analysis and interpret them. The next step is to practice evidence-based medicine. If after 10,000 tests there is no evidence that they could not be automatically verified with exactly the same results, then this should not be dealt with. At the same time, if 10,000 analyzes provided new medical information, then they should be reviewed in the light of new knowledge. So far, evidence-based practice is at the initial level.
Training
Another problem is to help laboratory assistants not only study the instructions for the hematology analyzer, but also understand the information received with its help. Most experts do not have this knowledge of technology. In addition, limited understanding of the graphical representation of the data. Its correlation with morphological findings must be emphasized so that more information can be extracted. Even a complete blood count becomes too complex, generating a huge amount of data. All this information must be integrated. You need to weigh the benefits of more data than the additional complexity that it introduces. This does not mean that laboratories should not accept high-tech achievements. It is necessary to combine them with the improvement of medical practice.