The flowchart is a graphical display of a process that clearly shows the systematic sequence of all stages of the task, as well as all the groups that are involved in this process. Such a scheme is a system of graphic symbols (blocks) and transition lines (arrows) between them. Each of these blocks corresponds to a certain step of the algorithm. Inside such a symbol, a description of this action is given.
What are flowcharts used for?
The mentioned systems are designed to perform the following functions:
- develop a new process;
- describe and document the current algorithm;
- develop modifications to this process or investigate links with the possible occurrence of errors and failures;
- determine when, where and how to change the current algorithm, in order to verify the stability of the entire system.
Workflow development
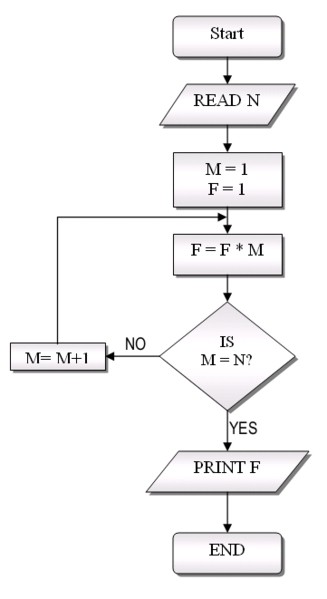
Any block diagram is based on an action algorithm that describes the operation of a device or program. Therefore, the system itself is built first. "Algorithm" is a description of the sequence of operations to solve the problem. In fact, these are the rules for the implementation of the necessary information processing processes . Before proceeding with the construction of the algorithm, it is necessary to clearly define the problem: what needs to be obtained as a result, what initial information is needed, and which is already available, are there any restrictions for obtaining it. After that, a list of actions that must be carried out to obtain the desired result is compiled.
Types of Algorithms
In practice, the following types of flowcharts are most often used:
- graphic, that is, the basis are geometric symbols;
- verbal: compiled using ordinary words of a particular language;
- pseudo-codes: they are a semi-formalized description in a conditionally-algorithmic language, which includes elements of a programming language and literary phrases, as well as generally accepted mathematical symbols;
- software: only programming languages are used for recording.
Device block diagram: description
A graphical representation of the sequence of actions includes an image of an algorithm that describes the relationship of the functional blocks of this circuit, which correspond to the performance of one or more actions. The block diagram of the array consists of individual elements, the dimensions and construction rules of which are determined by the state standard. For each type of action (data input, calculating the values of expressions, checking conditions, controlling the repetition of actions, finishing processing, etc.), a separate geometric figure is provided , presented in the form of a block. These symbols are connected by lines that determine the sequence of actions.
The main elements used in the preparation of flowcharts
A complete list of graphic symbols used to describe the algorithm consists of 42 elements. We will not give all of it, but consider only the main one.
Elements of the flowchart:
1. Process means a computational action or a sequence of such actions that change values, place data, or represent a form. For clarity, such elements can be combined into one unit. This symbol has the form of a rectangle, inside which comments are written that accompany the operation (or group of operations).
2. The decision. This block is used to indicate a control transition under a certain condition. Each such element indicates a question, comparison, or condition that defines it. In other words, a solution is a choice of direction for executing a program or algorithm depending on some variable condition. The graphic view of this element is a rhombus. The mentioned symbol can be used as an image of the following unified structures: selection, fork complete and incomplete, the cycle “before” and “so far”.
3. Modification. This block marks the beginning of the cycle. It is used to organize a cyclic structure. Inside such an element, the parameter of the circle of actions is recorded, its initial values, the boundary condition, and also the step of changing the parameter for subsequent repetition are indicated. In other words, modification is the execution of changing teams or their groups, operations that change the program. The graphic image of this symbol is a hexagon.
4. A predefined process means calculating according to a given or standard program. It is used to indicate access to the auxiliary algorithm, which exists autonomously in the form of separate independent modules, as well as to access library routines. Graphically, the appearance of this symbol is represented by a rectangle with two vertical fields at the edges. This element is used to indicate calls to functions, procedures, and program modules.
5. Data input-output in general form.
6. Start and stop. This element means the beginning and end of the algorithm, as well as entering and exiting the program. Graphically, this symbol resembles a rectangle with arcs instead of side lines.
7. Document means printing the results of work. Graphically, such an element resembles a rectangle, but instead of the bottom line, a half-wave is drawn.
8. Manual entry means starting data into the processing process by the operator using a device that is paired with a computer (keyboard). The graphic symbol for manual entry is a quadrangle in which the side lines are parallel, the lower one is perpendicular to them, and the upper one is oblique.
9. Display means input or output of information when the device is directly connected to the processor. At the moment when the data begins to play, the operator can make changes during their processing. Graphically, this element represents a figure in which the lower and upper lines are parallel, the right is an arc, and the left consists of two lines in the form of an arrow.
10. Flow lines are arrows that indicate a sequence of links. No block diagram of the structure can do without this element. There are certain rules for drawing these characters. We list them:
- these elements should be parallel to the lines of the outer perimeter or the borders of the page on which this block diagram is depicted;
- the direction of the line from top to bottom or from left to right is considered the main one, it is not indicated by arrows, the remaining cases of indicating directions are indicated by them;
- the change in direction of this element is made only at an angle of 90 about .
11. Connector. This element is intended to indicate communication on interrupted flow lines. These symbols are used if the block diagram of the program is built of several parts. Then the flow line from one part should end with a “connector”, and the new part should begin with this symbol. The same serial number is placed inside such an element. The graphic image of the “connector” is a circle.
12. Interstitial connector. The purpose of this element is similar to the previous one, only it is used to connect flowcharts placed on different pages. The image of such an element is represented by a pentagon in the form of a house.
13. Commentary is the relationship between the various elements of the flowchart with explanations. This element allows you to include formulas and other information.
Building flowcharts
Graphical construction of an algorithm is part of the documentation for a device or program, which is always in abundance. However, in most cases, the software does not need a flowchart at all. Only units require the construction of an algorithm that spans several sheets, while the rest needs a rather symbolic scheme. A simple block diagram shows the branching structure of programs in only one aspect. However, even such a structure is clearly visible only if the algorithm is placed on one sheet. In the opposite case, when the flowchart is located on several pages connected by interstitial transitions, it is very difficult to get the right idea about it. If it is placed on one sheet, then for a large program this image of the algorithm turns into its general plan with a list of main blocks and stages. Of course, such a schedule does not follow the standards for constructing schemes, but it does not need them, since this process is completely individual. Rules regarding the type of characters, arrows, and numbering are only needed to parse detailed flowcharts.
Arrays and construction of algorithms
An array is a collection of the same type of information that is stored in consecutive memory clusters and has a common name. Such cells are called "system elements." All clusters are numbered in order. This number is called the "array element index". How to create a block diagram for such a system? Consider an example of creating an algorithm for an elementary array of one - dimensional type. The simplest system is conventionally a string. Set the name for this array - “A”. We assume that our system consists of eight cells (from 1 to 8). Each of these clusters contains a random number called an "array element". For reference in a specific cell, you must specify the name in square brackets ([3]). Consider an example in which the block diagram of the array is designed to fill the system with random numbers and then display information on the screen. What is such an algorithm? This is an elementary system. In fact, it has no practical application, but is convenient for the educational process. The block diagram under consideration (an example of construction is described below) contains a total of seven basic elements connected by transition lines.
Description of the task sequence
1. The first element of the diagram will be the “Start” symbol.
2. The second block is the “Process”, inside which we enter “initialization random”.
3. The next element is “Modification”, in the block we enter the value of the cells of the array.
4. Further, according to the specified function, there is a redirection to the next block of the "process", in which an appeal is made to specific clusters of the system indicating the restriction of random numbers in the range from zero to one hundred. After this operation, there is a return to the third block, and through it - further to the fifth.
5. In this block “Modifications”, according to the entered function, there is a redirect to the next element.
6. “Output” displays information about the new contents of the array on the monitor, followed by the direction to the previous block. Next - to the last element.
7. The "end" of the algorithm.
Based on such a block diagram, a program is compiled that will ensure the operation of the presented algorithm.
"Flowchart Editor"
If you are wondering about how to draw up a flowchart, then know that there are special programs that are designed to create and also edit such systems. The convenience of graphical display of the algorithm is that the user is not tied to the syntax of a particular programming language. The constructed block diagram is equally suitable for all languages (for example, C, Pascal, BASIC and others). In addition, the editor can be used to build diagrams and verify the health of circuits. Such a program is a specialized software. It provides a diverse set of tools necessary for building flowcharts, which makes it more convenient than conventional graphical editors. Additional options allow you to optimize the process of compiling the system with its further transformation into functions and procedures of the programming language. In addition, the flowchart editor offers a set of templates that can significantly speed up the work of a novice user. After all, it is known that when constructing an algorithm, repeated structures are often used, for example, various loop options, alternatives (complete and incomplete), multiple branches, and so on. The editor allows you to select elements that are often used in flowcharts and add them to the created chart. This eliminates the need to redraw them every time. In addition, using the editor you can import functions and procedures implemented in any well-known programming language. This option is useful for parsing the structure of an algorithm that is written in an unfamiliar language. The system requirements of this program are quite modest, which allows you to use it on any personal computer.
Conclusion
Summing up, I should note that the detailed algorithms are already outdated. As a description of the process, they are of no interest to anyone. In the best case, flowcharts are suitable for training beginners who do not know how to think algorithmically. The elements proposed at the time with their content were a high-level language; they united machine language operators into separate groups. At the moment, each graphic element corresponds to a specific operator. This means that the symbol itself has turned into a random, and most importantly - useless lesson in drawing, which can easily be abandoned. Today, even transition lines have become redundant, since each operator is already defined. In fact, the graphical construction of algorithms is more extolled than applied in practice. A programmer with extensive experience rarely writes a block diagram before writing a program. When the organization’s standard requires a graphical algorithm, they draw it after the work is completed.